My thoughts on the numbers. . .
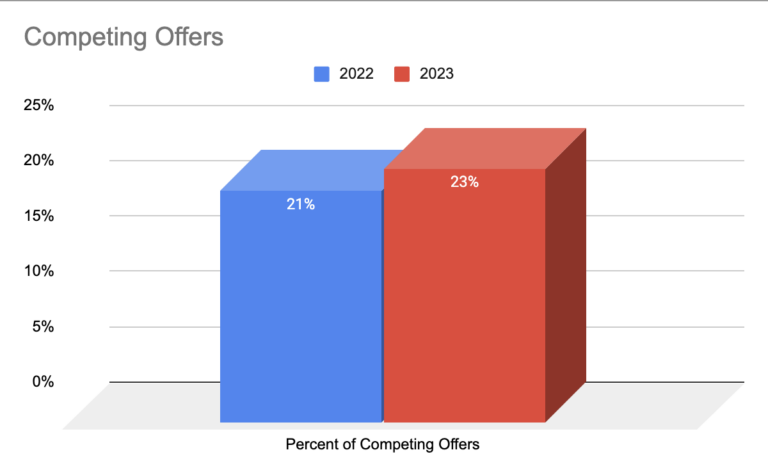
In the housing price data below, Cary and Morrisville had the greatest number of competing offers, however, price increases didn’t necessarily reflect that competitiveness. While Cary had competing offers on 32% of sold properties, the year over year sales price was less than 1%. This doesn’t seem to make sense on the surface, but remember that these numbers fluctuate a lot from month to month. The previous month (September) Cary saw an 11% YoY price increase. When we average it out across the year, we will get a better picture of market dynamics.
Here were our 2023 Market Predictions.
Similarly, Morrisville saw a huge median sale price increase of 41%!! That’s jut crazy… but it’s not uncommon to see these drastic jumps in small towns where there aren’t a lot of sales. If you have questions about a particular town, feel free to reach out to me at ellen.pitts@compass.com
Median Price Change & Competing Offers
Median prices can frequently increase and decrease by month. If we see multiple months in a row with a consistent increase or decrease, that can tell us the market is shifting. The percent of competing offers is the strongest indicator of market competitiveness. Sign up for our newsletter to be kept in the loop.
| Triangle Area Town | Median Price | % Change: Year over Year | % Competing Offers |
|---|---|---|---|
| Apex | 561,125 | 0.69% | 10.95% |
| Cary | 557,000 | -0.09% | 32.26% |
| Chapel Hill | 619,750 | 6.85% | 16.30% |
| Clayton | 349,495 | -7.30% | 11.90% |
| Durham | 420,955 | 7.33% | 19.35% |
| Fuquay-Varina | 454,405 | -4.65% | 10.94% |
| Garner | 429,000 | 9.30% | 11.11% |
| Holly Springs | 590,000 | -4.41% | 20.00% |
| Morrisville | 609,000 | 41.63% | 34.78% |
| Raleigh | 425,500 | 3.89% | 22.13% |
| Wake Forest | 570,500 | 8.67% | 12.04% |
| Wendell | 409,400 | -10.14% | 5.08% |
| Zebulon | 344,990 | -4.13% | 3.77% |
Expired Listings
Expired listings are a great metric to tell us when the market is shifting! The less competitive the market, the longer homes will take to sell and the more will expire from the market without selling. Keep in mind that when you see a negative percent in the expired listings table, that means the market has LESS inventory and more competition in the market. A positive percent means there are more properties listed that expire without selling. NEGATIVE = HOT MARKET POSITIVE = SLOW MARKET. See my thoughts on the data below…
| Triangle Area Town | Expired Listings 2022 | Expired Listings 2023 | Percent Change |
|---|---|---|---|
| Apex | 13 | 6 | -53.85% |
| Cary | 15 | 12 | -20.00% |
| Chapel Hill | 7 | 8 | 14.29% |
| Clayton | 22 | 6 | -72.73% |
| Durham | 41 | 30 | -26.83% |
| Fuquay-Varina | 7 | 5 | -28.57% |
| Garner | 4 | 8 | 100.00% |
| Holly Springs | 6 | 6 | 0.00% |
| Morrisville | 5 | 3 | -40.00% |
| Raleigh | 74 | 40 | -45.95% |
| Wake Forest | 6 | 5 | -16.67% |
| Wendell | 4 | 6 | 50.00% |
| Zebulon | 2 | 3 | 50.00% |
AVOID THE MOST COMMON HOMEBUYER NIGHTMARES
Our FREE PDF, Common Homebuyer Nightmares and How to Avoid Them! tells you everything you need to know.

My thoughts on the numbers. . .
Expired Listings
Four towns had an increase in expired listings. They were: Chapel Hill, Garner, Wendell & Zebulon. Again, the extreme limitations of listings is impacting the percentages here. It is also important to note that many of the expired listings were new construction listings that in most cases, hasn’t been built yet. This is how builders keep an eye on buyer demand to make sure they aren’t overbuilding.
View homes for sale in each Triangle Town, City, or County HERE.
Just Listed Homes in the Triangle
