How has the Raleigh Housing Market played out in the first part of 2023?
Which Triangle towns are increasing in value?
Which are decreasing?
- Out of 15 cities in the Triangle, 5 of them had both month over month and year over year property value increases.
- And four towns had median value decreases in both month over month and year over year values.
We’re also going to look at which towns had the most competing offers. And how likely it is that you will encounter competing offers wherever you’re planning to make an offer.
Raleigh Housing Market 2023: Availability
A lot of the price fluctuations have to do with availability of housing. The more inventory there is, the less likely the area is to increase in value. Towns where there is very little land available to build on, generally speaking, have more appreciation.
But as you’ll see, that doesn’t always hold true.
We’re definitely going to see some rule-breakers and I’ll dig into the details to show you some reasons those areas didn’t follow those basic economic principles.
Something else to keep in mind, is that areas that saw decreases in value, doesn’t necessarily mean that individual properties are decreasing. It can mean that in certain situations, but here’s a great example of what I mean.

My daughter bought a home last year in a brand new subdivision. This year, there is still significant construction happening in her neighborhood, however, because of market conditions, the builder has shifted the product they are building. The median home price in the neighborhood this spring is 4.7% lower than it was last spring. But the median size of the homes being built has also decreased… by 18%.
Last year they were building homes that were just under 2200 square feet, now what they are building is just under 1800. All that to say, that while this data does tell us something, it’s generalized information and if you want specific information about an area you’re considering buying in or selling in, you need to call me so I can pull specific data on your area. [919-725-1885]
Now let’s look at the data. First we’re going to look at the areas that increased. And then we’ll look at the areas that decreased.
Raleigh area cities with an INCREASING MARKET
There were 5 cities that had median value increases both month over month and year over year. They are:
- Raleigh
- Cary
- Garner
- Zebulon
- Chapel Hill.
If you want to take a look at the beginning of the year predictions, try this post about the 2023 Raleigh Housing Market
- Raleigh had a 1% annual increase and a 3% monthly increase.
- Cary had an 8% yearly increase and a 14% monthly increase.
- Garner had a 10% annual and 9% monthly increase.
- Zebulon had a 1% annual and an 8% monthly increase.
- And Chapel Hill had a 13% yearly and a 5% monthly increase.
Now we expect cities like Raleigh, Cary and Chapel Hill to increase. And even though Garner isn’t the most popular suburb, which we will get to in a minute, I expect continual increases in Garner as well, because. . .
Side note about the Garner Housing Market
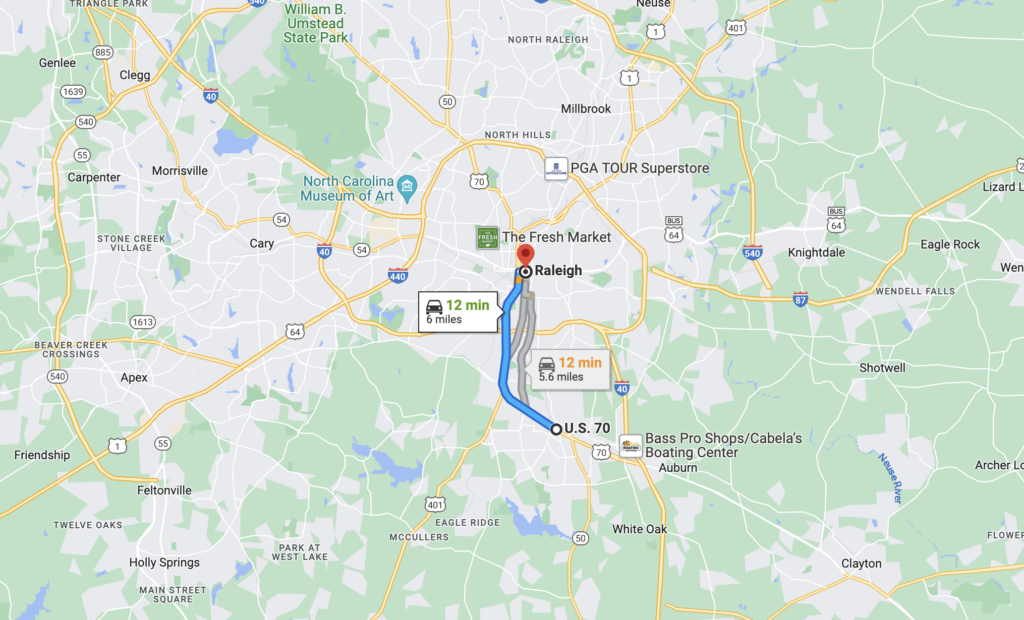
Okay, here is the deal with Garner. It’s a totally different situation there than anywhere else. Garner’s location is so incredibly valuable. Look at this. It’s 5 miles from downtown Raleigh. It’s genuinely the closest suburb you can be in if you want to have easy access to downtown, and not actually live downtown.

What’s weird about Garner is it still hasn’t created any kind of interesting or significant commercial development. There’s big box stores and that’s about it. Garner is almost exactly the same distance from downtown as North Hills is. And yet, where is all the development?
They have a little downtown. And they have White Oak Crossing on the south side of Garner which provides big box shopping for both Garner and Clayton. But they don’t have any kind of upscale shopping or restaurants that a town in this location should have.
But it’s coming. John Kane’s downtown South development is still in downtown Raleigh, but in an area that is underdeveloped, which is bringing the bougie stuff just a little bit closer to Garner. And I think once that south side starts to develop, it’ll have an effect on Garner.
I’m being honest, I don’t know why Garner doesn’t do more with their insanely valuable location. I just don’t get it. Knightdale is developing, Wendell is developing, heck even Clayton out in the boonies is developing. I’m just kiddin, I love me some Clayton.
If you live in Garner or you’ve heard about something happening out that way, drop me a comment and let me know, because it’s about time to get that ball rolling. If you want to get in on the Garner market before it really gets going, check out the homes for sale in Garner.
Back to the Raleigh Housing Market Winners!
Okay, that was a pretty big detour. My point with that whole diatribe is that in the greater Raleigh housing market (2023) we expect Raleigh Cary, Chapel Hill and Garner to appreciate. But Zebulon, threw me for a bit of a loop. I wasn’t expecting that, but it wasn’t a huge appreciation, just 1%. But it was appreciation, and it was unexpected, given how much raw land there is to develop in Zebulon.
But sometimes you can find a reason if you dig into it enough.
I looked a little closer and found that in 2022, 42% of Zebulon’s home sales were new construction but in 2023 66% of Zebulon’s home sales were new construction. A pretty big jump.
New construction costs more than an existing home. So even though there is more inventory than every other area that appreciated, shifting to a higher percentage of new construction can also make the median price higher. That’s a pretty good explanation. It’s also a good example of why simply looking at the median home price has its limitations when comparing year over year growth. But it’s the best we’ve got.
Raleigh Housing Market Losers
Now let’s look at the losers. We’re going to look at all the towns that depreciated in May compared to the same time last year. These are areas where you might pick up a deal or avoid most multiple offer situations if you’d rather not get into that. Although they are happening in all towns, just much less in these areas.
There were six towns that had year over year depreciations.
I’m not really going to talk about the month over month, because honestly there is virtually no value in discussing that. Prices go up and down by the month all the time. The annual numbers are what really mean something. Although if you have several months decrease in a row, that does give you an idea where the year is headed.
Anyway, we did have a couple of outliers in the decreasing category.
- Morrisville decreased 2%
- Holly Springs decreased 3%
- Clayton decreased 8% year over year
- Wendell decreased 4% year over year
- Wake Forest had an 8% annual decrease but also an 8% month over month increase. So you can see how quickly that annual decrease can turn around.
- And Durham decreased 1% year over year.
Now let’s talk about those outliers.
The Morrisville Housing Market is an Outlier
Why are we seeing decreases in areas that are pretty densely populated and don’t have a lot of room for development, like Morrisville. Honestly, it’s not surprising.
In all the other towns they all have lots of room for growth, which means builders can build plenty of homes, which means pricing doesn’t have that upward pressure. But in Morrisville, that’s not the case.
So why did values decrease in Morrisville?
It’s actually a pretty simply explanation.
- Last year the median size of a home was 2310 square feet.
- This year it was 2189 square feet.
- That’s a 6% decrease in home size.
- But Morrisville only had a 2% decrease in median price.
What that means is people simply bought cheaper homes in Morrisville this year, probably because of the interest rates.
When comparing homes of the same size, there was probably still a price appreciation.
There are still other variables that need to be considered to find out if that is true. You can’t just do a straight price per square foot comparison because some homes have more expensive features.
You wouldn’t compare a home with a pool, big screened porch and a 3 car garage to a home with none of those things and expect to get a similar price per square foot. These are the things we take into account when I do a price analysis for a listing, which I’m not going to do now, honestly because there isn’t enough inventory with enough detail to make a strong case. I could only find one house that was 2300 square. But hopefully this analysis helps you see that there is more to value fluctuations than meets the eye.
If you want to look at the homes for sale in Morrisville yourself, head on over to the Morrisville Homes For Sale page.
Competing Offers 2023
Now let’s look at which towns had competing offers. And then I am going to share one caveat to this information.
Most competitive
The absolute most competitive towns with more than 30% of listings getting multiple offers were in order from most to least competitive:
- Cary
- Morrisville
- Durham
- Chapel Hill
- Raleigh.

Moderately competitive
- Apex and Holly Springs were moderately competitive with 20% & 25% of listings receiving competing offers.
- Wake Forest had 15%,
- Wendell had 13%,
- Clayton had 11%,
- both Fuquay and Garner had 10%
- and Zebulon, again our outlier, had 9% of listings receive competitive offers.
Caveat: The market is always changing.
The data I have presented is from May of this year. This week, as the above video was in production, I have experienced or had Realtor friends experience some situations in the market that leads me to believe it is getting more competitive.
Now these situations are ongoing, so I’m not going to give specifics. But in one situation, an offer with a $100,000 due diligence deposit was REJECTED because it wasn’t the best offer.
And in another case an offer was made that was $100,000 over list price.
It does feel like things are heating up a bit, but I don’t think that is the norm. There are definitely still ways to get into the market and stay away from situations like this, which were the norm last year.
I’ve got a full market report that I am glad to share with you. It has the months of supply for each town, the days on market for each town, the number of showings per listing for each town, and a few other interesting data points.
If you would like a copy of it so you can look more closely, there is a link in the comments to the video to get it.
If you liked this post, you’ll probably like this one about how Cary had some totally crazy things happening in their property values and I debunked some people’s ideas about what that meant.

