A couple weeks ago I posted my market predictions based on a single metric: expired listings. But that really only tells us part of the story. Now that all the data is in, here’s what happened in Cary in the first quarter of 2017…
The average days on the market for the 1st quarter was 31 days. That is the shortest days on market on record! Homes are selling super fast. New home builders are definitely starting to meet demand for new homes. New home sales increased 48% and resale sales increased 2%. The median price for both resales and new construction is in the mid $400k’s in Cary.
All that sounds great. And if you’ve been reading my blog for awhile you probably know that there is always more to the story. I like to dig underneath to get at the real deal. In addition to expired listings, showings and inventory are two metrics that give hints to upcoming changes.
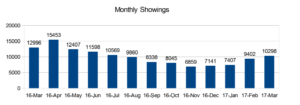
The following graph* shows the number of showings each month for the last 13 months. We always have that peak and fall in showings seasonally. You can see that showings in the cold months are quite a bit lower than that warm months. That’s perfectly normal. However, check out the first and last columns. You can see that showings for March 2017 are significantly lower than the previous year’s March showings. Showings decreased by more than 20%! For the last 4 quarters, that number has been either nearly the same or showings have increased. This is the first drop we’ve seen in awhile.

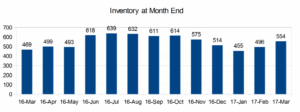
The next graph shows housing inventory. We have a similar dynamic with the seasonal shifting of inventory. You can see that many more people list homes in the warm months than in the cooler months. But again, look at the first and last columns. You can see that inventory in March 2016 is significantly lower than inventory in in March 2017.

This is definitely something to pay attention to. When we see both an increase in inventory and a drop in showings, that is telling us something about market health. That means there are fewer people looking at homes and more homes for them to look at. Like I’ve said before, this is not yet a trend. I would like to see 3 more quarters with this kind of change before I say our market is truly shifting.
Do you want to know what happens next quarter? Subscribe to the Harmony blog! You’ll find the dialogue box to the right side of your screen…
Other significant metrics:
- The average list price for new construction dropped by 1%, not really a big deal.
- There was a 40% increase in the number of sellers who dropped the price on their listing. The majority of those price drops were in the $500k price point.
Ready to start your search for a new home? Wake County Real Estate Search
*All graphs and data courtesy of T.A.R.R Report

