I’m going to tell you the best month to buy a house, and I have the data to back it up.
If you’re thinking about buying a home this year, you might be wondering if there are particular months that are better for purchasing. When are sellers are more negotiable on prices? When are there the most housing options to choose from?

In this article, we’re going to look at four data points that will give you some clues into the best months to buy a home in the Raleigh area.
- We’re going to look at the months where homes sold for the lowest percentage of the sales price.
- We’re going to look at the months that had the most inventory to choose from.
- We’re going to look at the months that had the fewest showings per listing.
- And we’re going to look at the months that had the least competing offers.
Once I’ve shown you all that, we’ll look at all the data together to find the month with the most inventory to pick from, that also has the least competition, to find the absolute best month to buy a home in Raleigh!
The Data
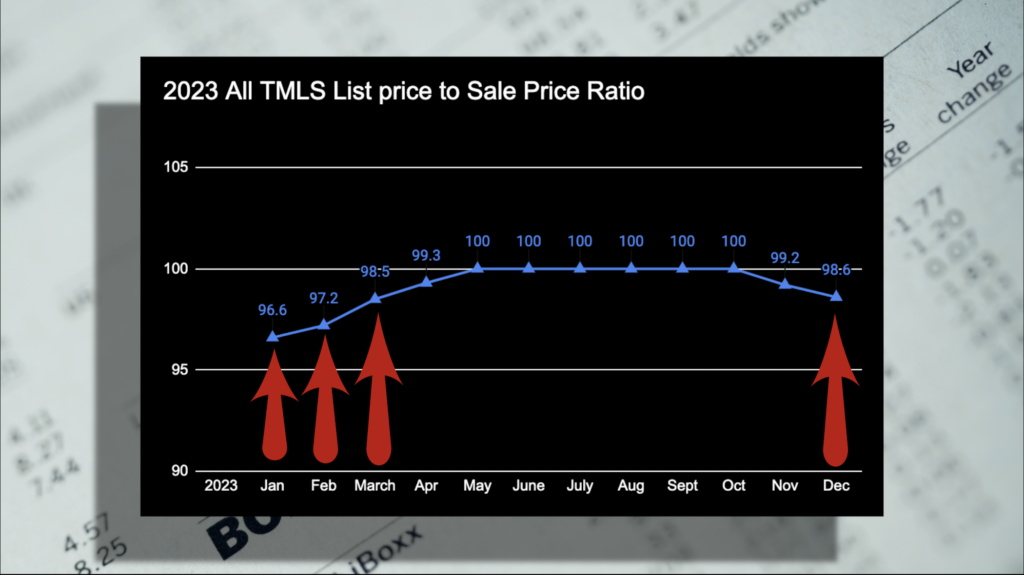
#1. Sales Price to List Price Ratio
Many people think that the months with the lowest sale price are the best months to buy a house.
And if you look at the surface level, it’s tempting to feel that way.
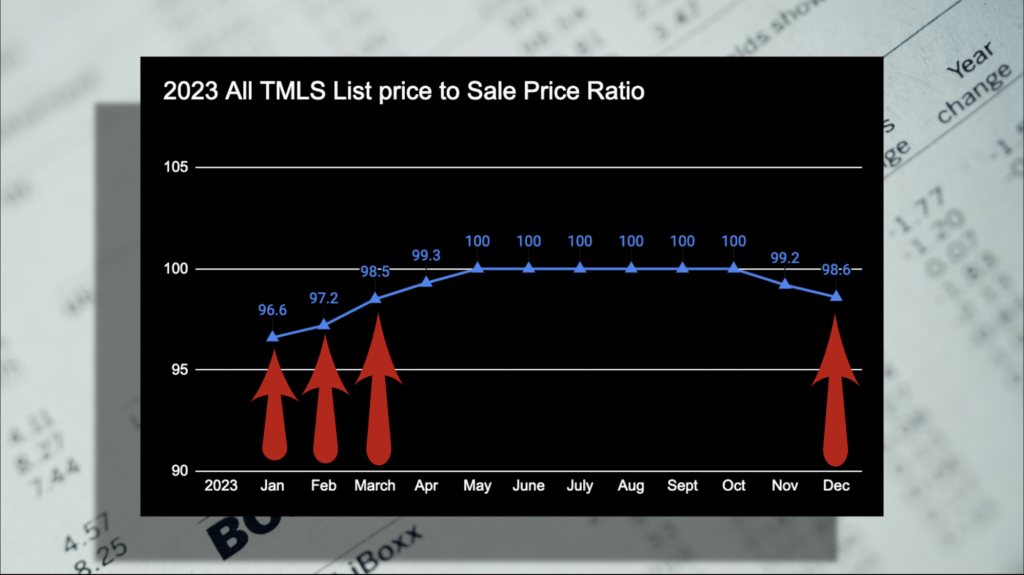
You can see that properties that closed in January, February, March and December seemed to have the biggest discounts. But there’s a big reason these are not necessarily the best months to buy. I’ll tell you why in just a minute.
#2. New Inventory
The number of homes listed on the market can have a big impact on how negotiable prices are.
If you have 20 homes in your desired price point and location to pick from, your offers are probably going to be lower than if you only have two homes to pick from.
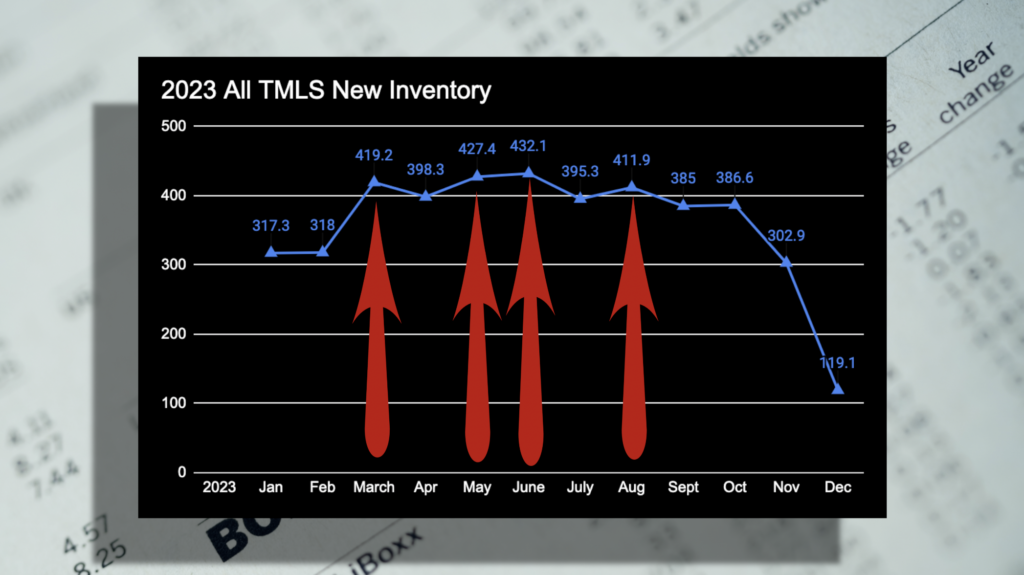
And you can see that March through October have the largest number of listings entering the market.
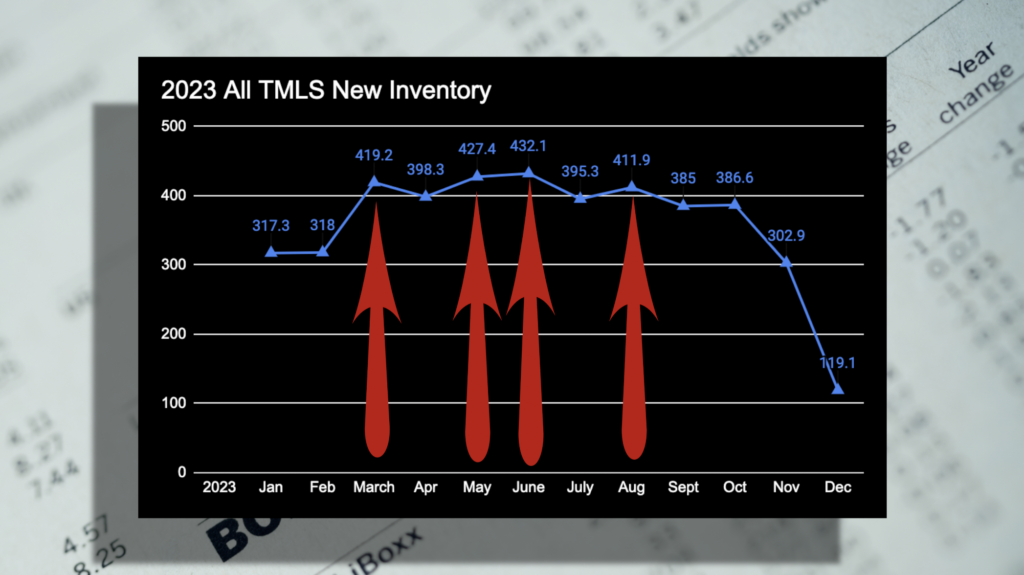
But don’t get too attached to this metric either. Because inventory only matters in relation to the number of people shopping. Which brings us to our next metric, showings per listing.
#3. Showings Per Listing
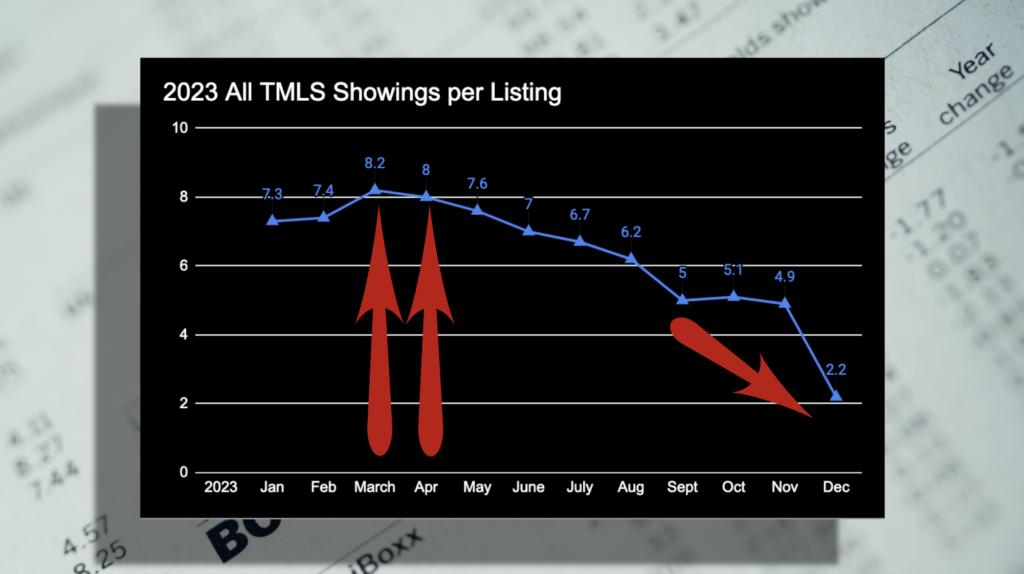
The number of people looking at homes for sale is generally at its peak in March and April.
Then it slowly drops off until the fall, where it falls off steeply.
Fewer showings means less competition, but you give up some things when you buy in those time periods. Don’t worry, we’re going to get to those trade offs!
#4. Competing Offers
Now, I just said a minute ago that having more inventory can mean fewer competing offers.
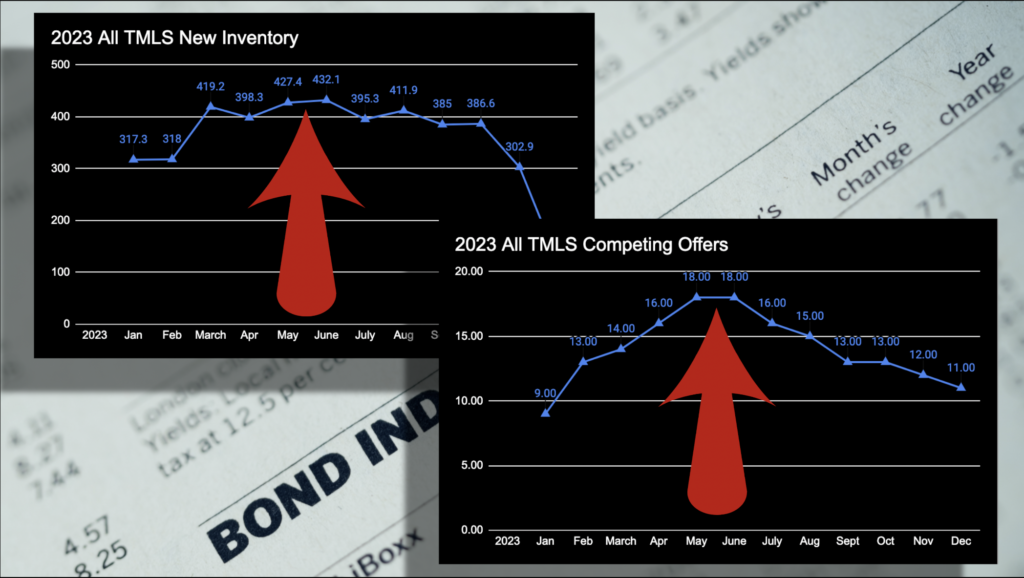
But when we look at this graph, it doesn’t really look that way.
The months with the highest inventory seem to have the highest number of competing offers as well.
There’s a reason for this, and we’re going to discuss that. You can’t look at just a single metric. You have to look at how these data points interact with each other.
Because there is also actually a secret month where all the data points converge to create the absolute best environment for getting a deal on a really nice home.
So let’s crunch these numbers and figure out which month it is!
The Lowest Sales Price isn’t Always What it Seems to be
If you’re looking for the absolute lowest sales price, you want to look at the months with the lowest list price to sale price ratio.
This is a number between zero and 100, that shows how much of a discount off the list price the home sold for.
So for example, the month with the lowest sale price to list price ratio in 2023 was January, with a 96.6% sale price.
This means that the average home in the MLS sold for 3.4% less than the list price.
But before you plan to jump on properties in this time frame, there is something you should know about properties sold in January or the other months that had the biggest discounts. And to find this, I had to dig a little deeper than the numbers.
What kind of homes have discounts?
The word “investor” was used in the agent remarks 31% more often in properties sold in the months with the lowest sales price to list price ratio than in properties that sold in the months with the highest sale price to list price ratio.
So what kind of homes do people advertise as investor type homes?
This is a home that sold in January of 2023.
This particular home was listed at $329,000 and sold for $280,000, a 15% discount.
An investor picked it up and resold it 6 months later at 100% of list price for $435,000 after doing this remodel.
That was a great home and it was a great deal. If you’re a contractor. Or just really good at renovations. But these kinds of sales are what really impacts the overall sales price to list price ratios in the winter months, making it look like it is a good time to get a good deal.
But if you’re looking for something move-in ready, winter time isn’t the best time to get that.
The truth is, there aren’t a lot of sellers that plan to list their home in the winter. Usually when people list in the winter, it’s more because they need to sell and people generally haven’t spent the time to get their home ready to put on the market.
There really aren’t a lot of great move-in ready homes for sale. But they do show up sometimes in the winter. This home sold for 1% above list price in Raleigh’s Lakemont neighborhood. Which goes to show you, that if the home is a really good property, it’s well maintained, staged nicely and move-in ready, it’s not going to sell at a discount even though it’s winter.
When Winter is a Good Time to Buy
If sale price is the most important metric to you and condition of the house isn’t as important… maybe you’re an investor or you just like putting your own personality into a house with your own remodeling, then wintertime might be the best months to make an offer on a home to find those really good rehab deals.
The months with the biggest discounts went under contract in November, December, January and February and closed in December, January, February and March.
While it might seem so on the surface, finding the month with the lowest prices isn’t the best criteria to use to find the best month to buy. For most people, it’s probably better to continue to rent and wait for more inventory to hit the market. Now let’s look at the highest inventory months.
Why High Inventory Months Cost You More
Now, if you’re looking for move-in ready homes, you’ll want to look at those months where sellers really start listing their homes.
We’re looking for the high inventory months.
In 2023, the month with the highest inventory was June. March, May, and August weren’t too bad either.
The downside to buying in the months with the most selection, is that multiple offers can be at their highest during this period.
In 2023, May and June had the most competing offers. It is true that the more inventory there is, the less competition there is. But there does have to be enough supply to meet the demand of the current buyer pool before those multiple offers disappear.
And in locations like Morrisville and Cary where there is very limited land to build more homes, there will likely always be competition in the market.
But, if we look at the months of supply for the Triangle as a whole, we can see that the spring months have the lowest level of inventory in relation to the number of buyer’s buying.
The spring was the strongest seller’s market in 2023.
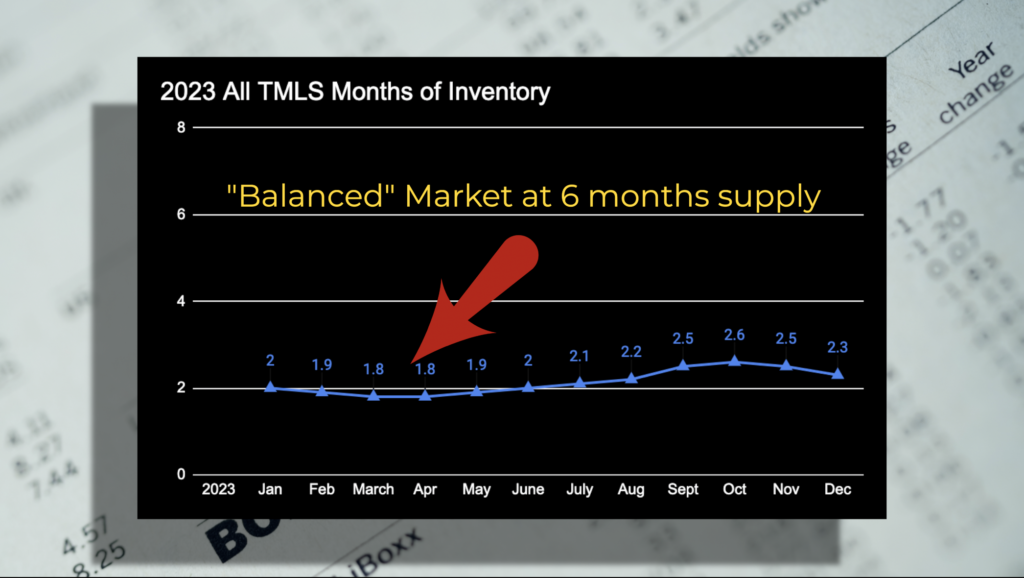
So, in our current inventory shortage, the best months to buy probably aren’t going to be the spring.
In a strong buyers market, like we had after the 2008 housing crash, the springtime with the most inventory was definitely the best time to be shopping. In 2011, the peak of the crash, March, April and May had the highest rate of listings to buyers of the entire year.
If we want to know the best month to buy in a housing shortage environment, it isn’t going to be in the spring. Let’s move on to showing numbers and inventory.
Showings Numbers and Inventory
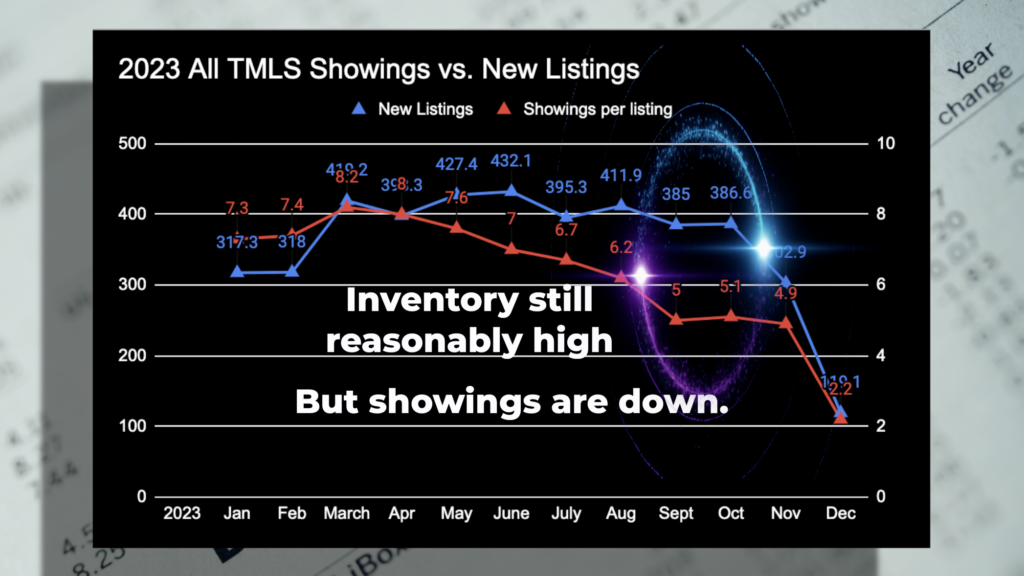
To find the best month to buy, we’re looking for that sweet spot where the showing numbers are down, but the number of listings is still fairly high.
So now let’s take a look at the number of showings per listing, by month. But we’re also going to pull in a few other points at the same time.
This is where we start looking at the data as a whole instead of the disparate parts. And we’re going to start seeing some really great opportunities to get into the market.
Multiple Offers
Let’s take a look at multiple offers. Offers that were made in the months of September, October, November and December had the lowest percentage of multiple offers.
Now for me, this gives me a little tingling in my spine. Because I would expect the months with the fewest multiple offers and the months with the lowest sales prices to match up. But there’s an outlier here. (Is this the correct chart?)
October didn’t show up in our lowest price group.
So October might be a month where you can find some nicely presented homes to the market AND when there aren’t as many people bidding on homes for sale.
And this pans out because when I looked for agent remarks about investors, there were 39% fewer investor listings than the wintertime dates when sales price to list price ratios were so low.
Also the showings to listing data looked really good for October compared to the springtime.
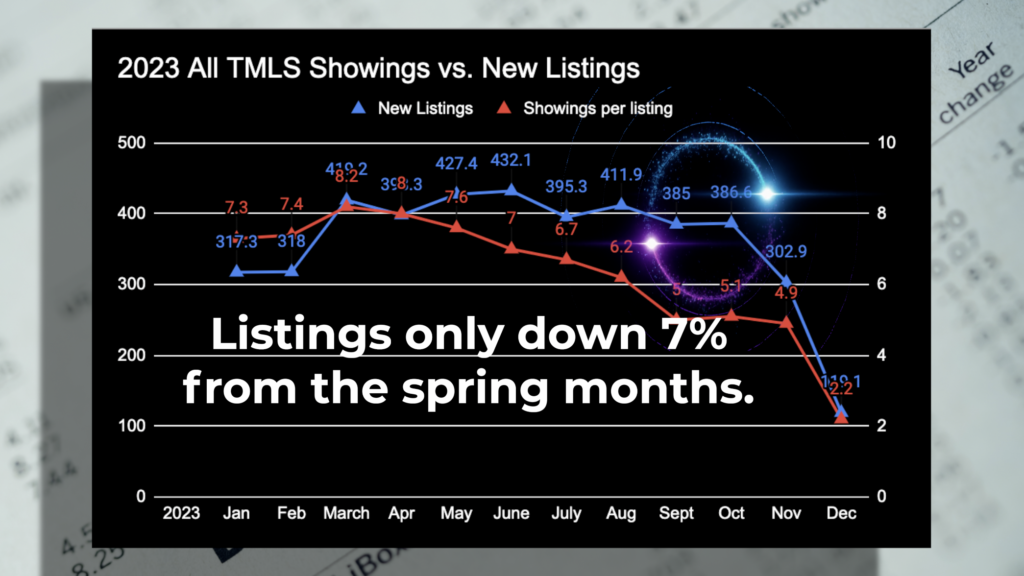
Springtime listings with the highest percent of sales price had about 7.9 showings per listing, but in October, each listing averaged about 5 showings.
That’s a 35% decrease in showings, but the number of listings that came on the market in October was only 7% below the average for the springtime months with the highest prices.
So you’ve got some inventory to choose from, you’ve got fewer buyers looking and you’ve got fewer people making offers. The month of October is the perfect month to buy a home.
The Best Time to Buy Is When You’re Ready
While historical data shows that October tends to offer buyers great opportunities, the reality is that the best time to buy a home is when you’re financially prepared and ready to commit to the process. Market conditions can shift, and while trends provide useful insights, there are no guarantees that inventory or pricing will follow the same patterns every year.
A great lesson from this is that the “traditional” times to buy—spring and summer—aren’t the only times worth considering. Many buyers overlook fall and winter, assuming they’re off-season, but those who stay flexible and open to opportunity often find great deals outside of peak market months.
Instead of waiting for the “perfect” moment, buyers should focus on what they can control—securing financing, understanding their needs, and being prepared to act when the right home becomes available. If you find a home that fits your criteria and budget, that might just be your best time to buy, whether it’s October or any other month of the year.
If you like this article, you might also be interested in this one, where I take a deep dive into the Raleigh housing market throughout 2023!


