Is there a housing market crash on the horizon? Many think so. Maybe there will be, but you’ve got to be careful about the arguments for or against a crash!
There are four North Carolina cities that appear to be at risk of a housing crash. GoBankingRates did an analysis of the largest 200 cities in the country and identified 40 that are at risk for a housing crash.
4 of them are in North Carolina.
THIS IS IMPORTANT! I detail why I found their analysis sketchy below, but after releasing the video, GoBankingRates changed their list. The four North Carolina cities in the article were deleted and two different NC cities were put in their place. Maybe they realized their mistakes? Just be cautious about accepting headlines and dramatic claims uncritically!
Housing Market Crash: Some online analysis aren’t worth the pixels they’re written on!
I’m going to tell you right off the bat that their research looks like complete nonsense.
And I am going to show you how I debunk sloppy research and how you can do it too.
There is often a lot of chatter on YouTube about cities that are primed for a housing crash, but so frequently those estimations are based on very little economic data that actually impacts the cost of housing.
But I had really high hopes for this one.
Because this analysis from GobankingRates identified real things that are happening that absolutely are indicative of the market being unstable in those areas. At least that’s what I thought when I looked at the criteria.
But once I started digging into it, I realized that they made some egregious errors in their analysis.
So I’m going to show you which cities they recognized as having tenuous markets, what their basis is for their opinion, then I’m going to show you why you should completely disregard most of this information… seriously throw it in the trash because it’s not worth the paper, or pixels, it’s written on. And we will also look at which of their data points do hold water, because some of them do. And when you see what I look at, you will be able to better navigate the misinformation that is often out there about housing.
GoBanking Criteria for IDing a housing market crash
The first thing I want to point out is that the North Carolina cities they say are getting ready to crash are not the most expensive ones. Far from it. They are actually some of the most affordable cities in the state. So when I saw this report, I was like, okay, it’s not going to be your standard “what goes up must come down.” Maybe they’re onto something.
GoBanking looked at the following criteria when determining the cities most likely to experience a housing market crash. They looked at:
- Mortgage delinquencies
- foreclosures
- and homeowner and rental vacancy rates.
(I’ve put screen shots of their methodology below. The first one is the original methodology. The second is their updated methodology.)
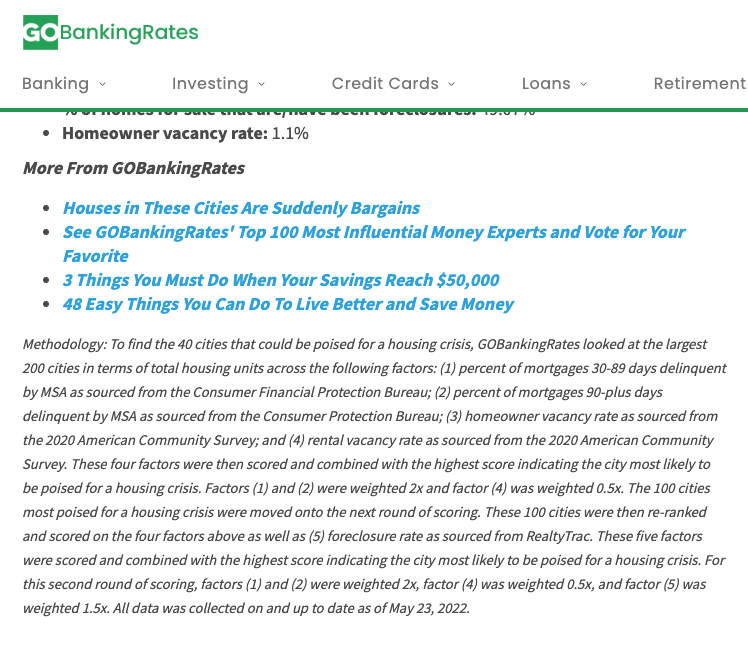
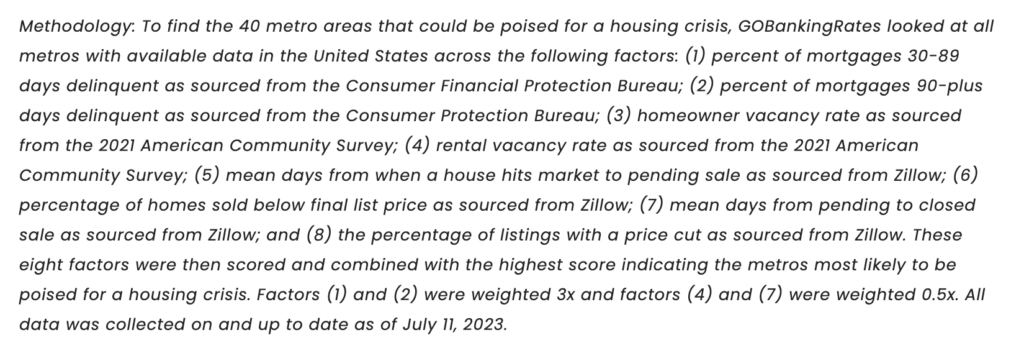
In my mind these are really great criteria. If a city has higher than normal delinquency rates, higher than normal foreclosure rates and higher than normal vacancy rates, there is something going on. And it’s not something good.
Let’s take a look at the cities now. They are:
- Wilmington
- Winston-Salem
- Greensboro
- Fayetteville.
Mistake #1: Foreclosure Data does indicate a possible housing market crash
And here’s where it gets dicey. Look at the data for Wilmington. Does anything stick out to you that might not make sense? And this is the first thing you should always look for when reading articles like this. Kind of like when you did word problems in school. Does the answer actually make sense? This does not, I promise.
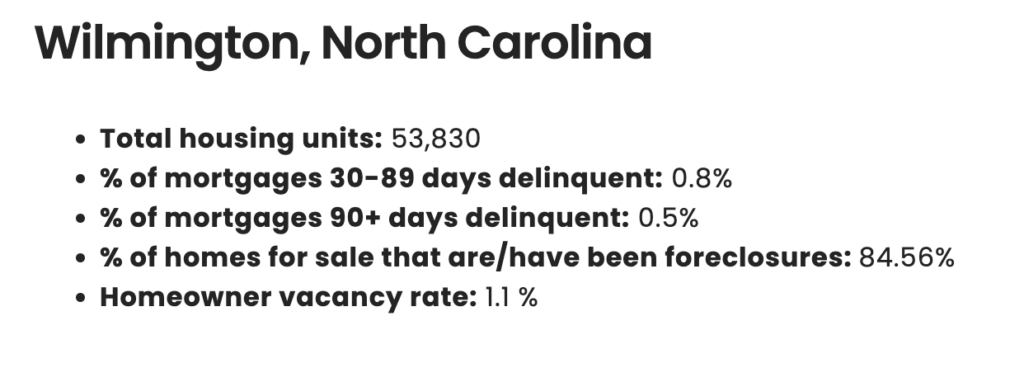
84.56% of homes for sale in Wilmington…… are foreclosures???
No way in H E double hockey stick is that true or that would be the leading headline on every paper in the country.
When I am reading these types of articles, I generally try to find their sources. If they don’t mention sources, I just totally disregard it. But this one mentions sources. Great. They got the foreclosure information from RealtyTrac.
So I go to RealtyTrac and I can enter in the city I’m looking for and the status. So I enter foreclosure, pre-foreclosure and auction. That gives me 221 properties. Then I select to add to this group, properties listed by real estate agents. Those would be the majority of properties typically listed in the MLS. And now I’ve got 242 properties.
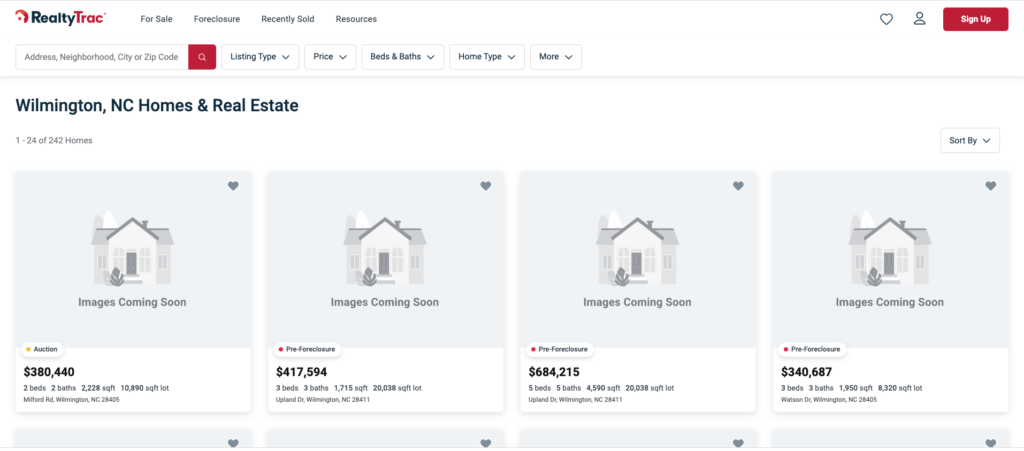
Only 21 properties in Wilmington are listed by Realtors in the MLS?
This is where my BS meter is going off in the back of my head.
Using the wrong data set to predict a housing market crash
So according to RealtyTrac, it seems that in the entire city of Wilmington, there are 242 total homes listed and 221 of those are bank owned or close to it? That would mean 91% of homes were foreclosures, pretty close to the number in the article, which makes me think this is exactly the process they used to get these numbers.
Poppycock.
Let’s go to Realtors property resource. This is a national database for Realtors that gives us a little more information than Zillow. You have to be a Realtor to access this but I’ll show you what I found.
When I pull up everything listed in the MLS for Wilmington right now, I get 1003 properties. Now I’m sure this was just an error, but it was a pretty big one. And a big part of their premise was based on simply faulty information. If you’re going to predict a housing market crash in cities across the country, you should be looking at the right data.
Take a look at the claimed foreclosure rates for all four cities. Yes, I checked for you, and yes, the numbers are off in all four cities. According to RealtyTrac, in Winston Salem, there were 10 properties out of 369 that were not foreclosures. In Greensboro there were 467 foreclosures and 1 that wasn’t a foreclosure. And in Fayetteville there were 506 foreclosures out of 587 homes.
Realtytrac appears to be a website that pulls foreclosures into one place, not someplace that lists ALL the properties on the market. I think the person gathering this data thought it was a listing of all homes for sale. They just misunderstood what they were looking at.
Mistake #2: Mortgage delinquencies
Now the rest of their criteria is actually pretty important and does show some issues, but again, it’s not at all what it looks like and they aren’t telling the whole story.
I’ll show you what they’re hiding.
They got their data about mortgage delinquencies from the Consumer Financial Protection Bureau. And you can see here that the southeast is pretty hurting with mortgage delinquencies right now. This is Raleigh with Durham right next door, both Raleigh and Durham are well below the national average for mortgage delinquencies.
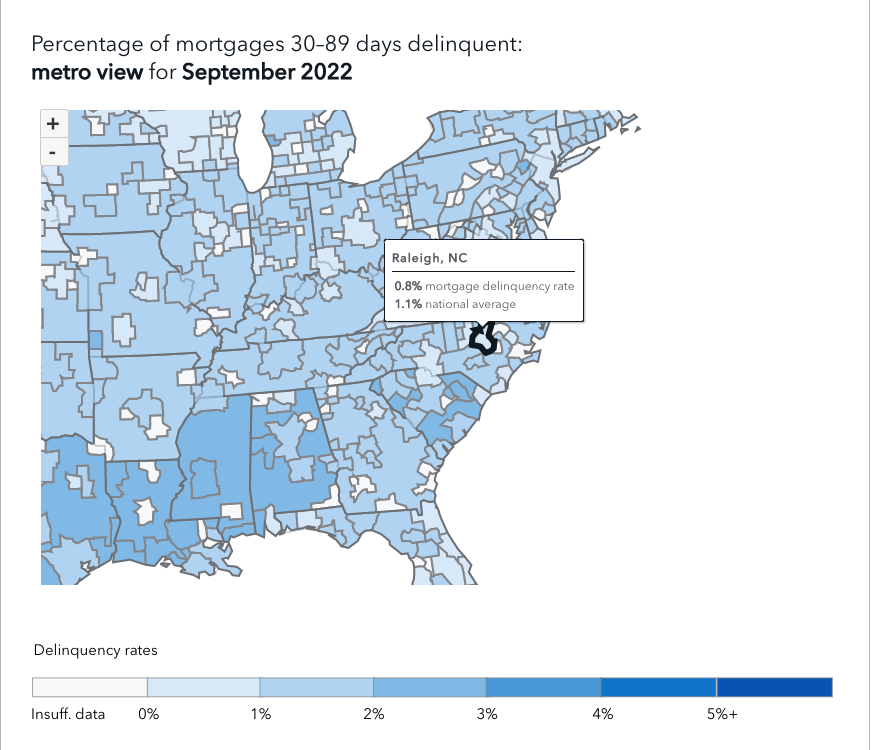
- Fayetteville is about 36% higher with a 1.5% delinquency rate
- Wilmington is lower, at the same rate as Raleigh,
- Greensboro has a 1.7% delinquency rate
- and Winston Salem is the highest at 1.8%.
So far Wilmington is not looking like it’s in trouble at all. Because basically two of their main criteria are irrelevant. Did I say irrelevant? Yes, I did because when it comes to delinquency rates you have to look at historical trends.
Hidden Data
So now let’s look at the hidden data that they didn’t show you. In January 2020, before Covid hit, delinquent mortgages were sitting at 2.2%, which is exactly DOUBLE the rate of the most recent data in Sept 2022. Do you look at that graph and say, we really should be concerned with mortgage delinquencies?? I don’t. You’ve got to put these things in context with the historical data.
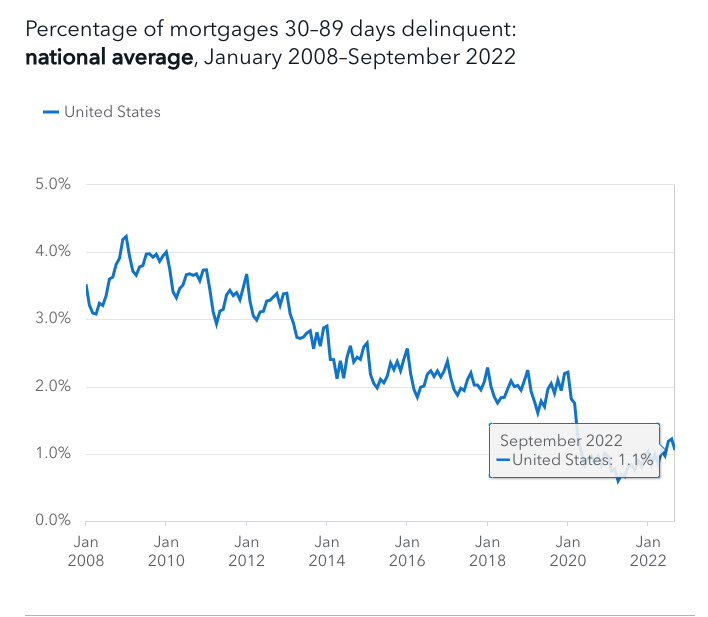
Now….the latest data is pretty old. A lot has happened since Sept 2022. Could there be more delinquencies now? Sure but these writers showed no proof of that. Again, if you’re going to tell people their property values are going to plummet in a housing market crash, you’ve got to show your work.
I went digging and found Black Knight’s report showing that mortgage delinquencies were at historic lows nationally in March of 2023. That leads me to believe this is likely not an issue in these cities.
Now let’s look at 90 day delinquencies. Here’s a look at Raleigh compared to the national average and again, Raleigh is significantly lower than the national average, which is at half its previous peak in January of 2020.
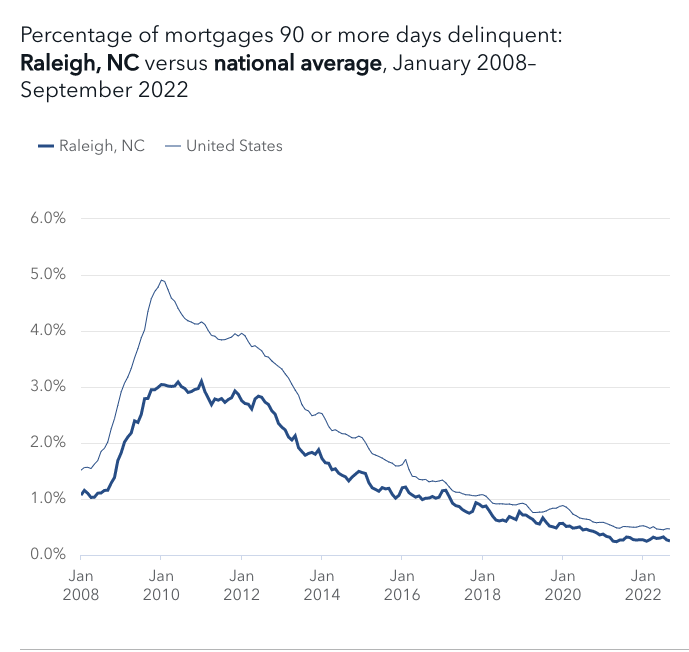
So we’ve just debunked, 3 out of 4 of their criteria. Alright, we have to look at #4, vacancy rates. What do you think, tell me in the comments, is it all going to be smoke and mirrors?? Tell me.
Vacancy Rates
Okay, now let’s look at vacancy rates.
Ding ding ding.
Guess where they collected this data from?
Okay, I’ll tell you.
They collected it from the 2020 American Community Survey. Let me read to you how they organize that data in the American Community Survey. This is from Census.gov.
The ACS estimates do not represent a specific point in time during the collection period, but rather a pooling of the data collected during the entire period. For 1-year estimates, the ACS uses data collected in that calendar year — January 1 through December 31. Similarly, the 5-year estimates use data collected over a 5-year period. For example, the 2016-2020 5-year estimates will use ACS data collected from January 1, 2016, through December 31, 2020.
Now, GoBanking doesn’t tell us if this is a one year or a five year estimate, but best case, the vacancy rates are from the year 2020.
Worst case they are a compilation of the survey data from 2016 – 2020.
Now I have no idea what vacancy rates are currently like in these cities. It could be much worse than the numbers shared here. They could be much better. The important thing is WE DON’T KNOW.
Have I missed any data here? Am I overlooking some serious data set that I just didn’t see? Tell me in the comments.
But for right now, you can call me crazy, but I don’t think any of these cities are crashing. Do you?
If you liked this post you should read this one about the North Carolina cities people are fleeing and in that one there’s some real stuff happening. It’s not a bunch of smoke and mirrors.
Here are their breakdowns of the four cities in the original article.
Wilmington, North Carolina
- Total housing units: 53,830
- % of mortgages 30-89 days delinquent: 0.8%
- % of mortgages 90+ days delinquent: 0.5%
- % of homes for sale that are/have been foreclosures: 84.56%
- Homeowner vacancy rate: 1.1 %
Winston-Salem, North Carolina
- Total housing units: 96,611
- % of mortgages 30-89 days delinquent: 1.3
- %
- % of mortgages 90+ days delinquent: 0.6%
- % of homes for sale that are/have been foreclosures: 36.90%
- Homeowner vacancy rate: 2.1%
Greensboro, North Carolina
- Total housing units: 118,126
- % of mortgages 30-89 days delinquent: 1.3%
- % of mortgages 90+ days delinquent: 0.6%
- % of homes for sale that are/have been foreclosures: 49.12%
Fayetteville, North Carolina
- Total housing units: 82,242
- % of mortgages 30-89 days delinquent: 0.9%
- % of mortgages 90+ days delinquent: 0.8%
- % of homes for sale that are/have been foreclosures: 21.67%
- Homeowner vacancy rate: 3.7 %
- Homeowner vacancy rate: 1.4%

